Mobile phones, attention, and road casualties in New Zealand
This page presents an analysis of New Zealand road casualty data in relation to the widespread adoption of mobile phones and smartphones. The analysis was originally developed using Ministry of Transport and NZTA data and formed part of a broader programme of research on attention, distraction, coordination, and driving behaviour.
The central question is: Why did the long-term reduction in New Zealand road casualties appear to slow and reverse during the period in which mobile phone use, and later smartphone use, became widespread? While many factors contribute to road trauma, the patterns shown below suggest that driver attention and distraction deserve serious consideration.
Alternative versions
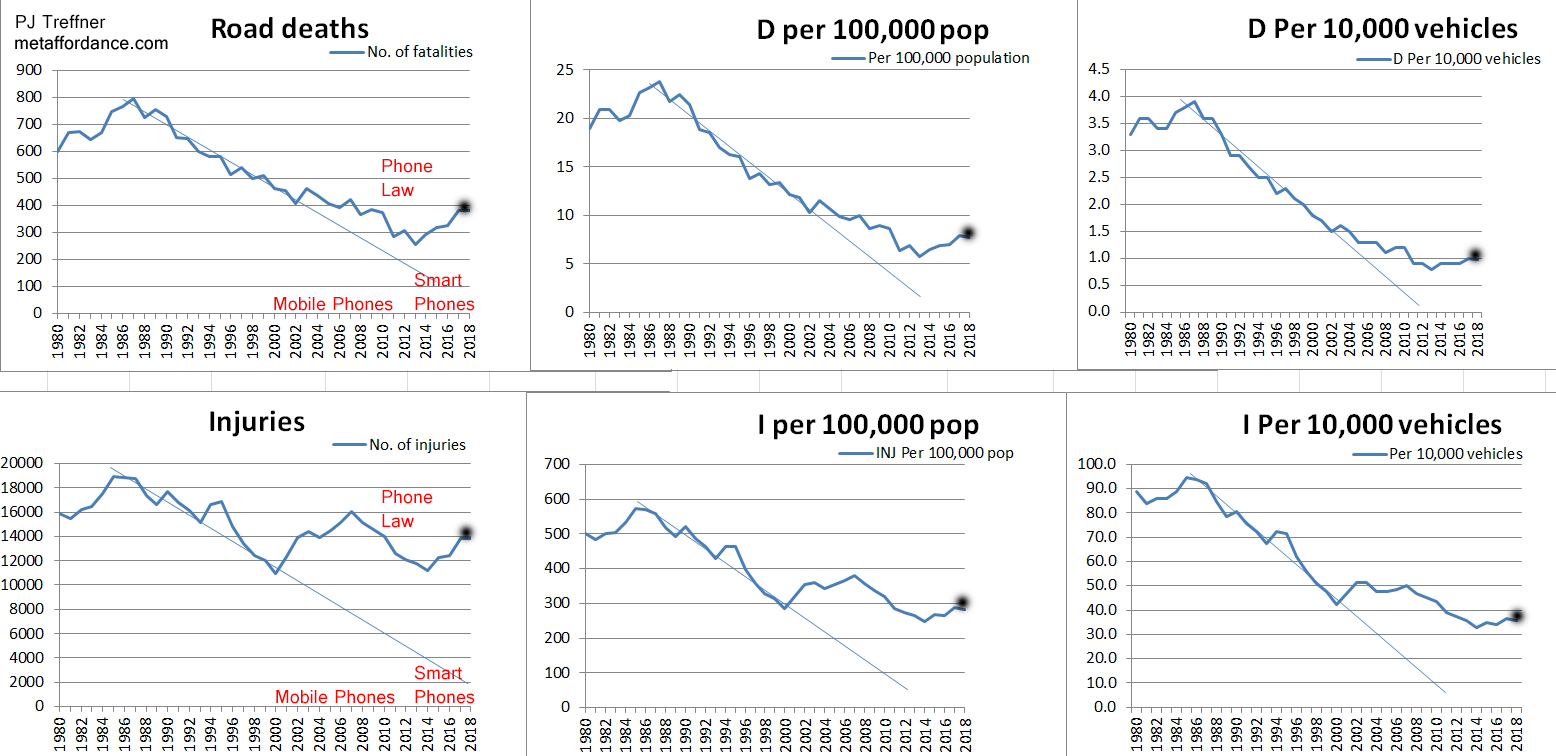
Mobile phone availability and road casualties
Analysis of Ministry of Transport data suggested a correspondence between:
- Rapid growth in mobile phone ownership beginning around 2000.
- Introduction of New Zealand mobile phone legislation in 2009.
- Widespread adoption of smartphones after approximately 2013.
- Changes in casualty trends during these periods.
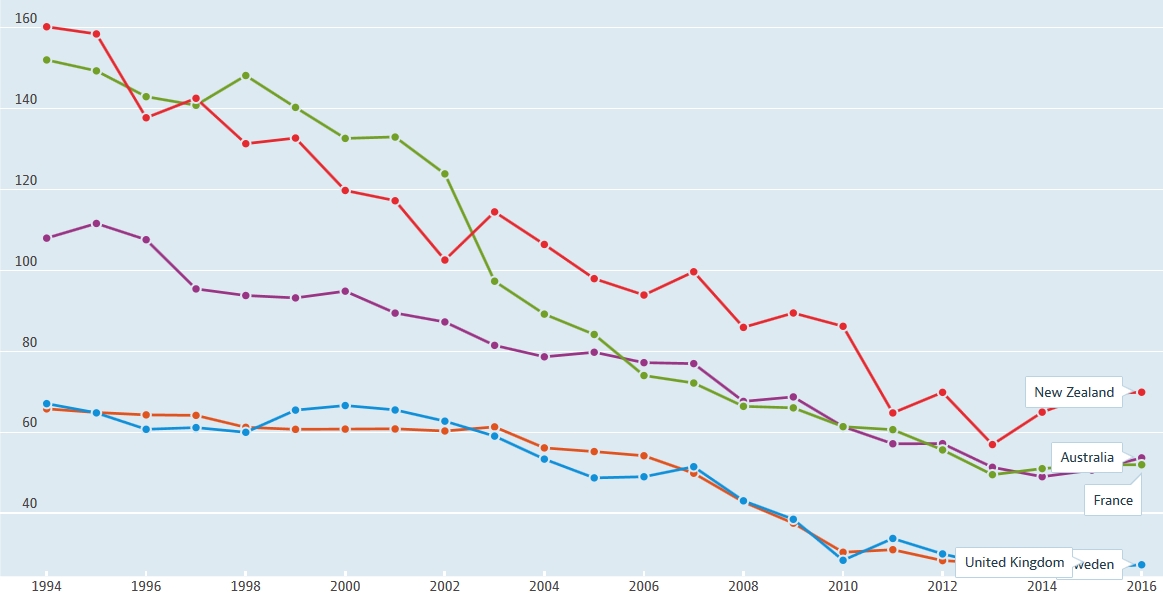
International comparison
Many OECD countries experienced substantial long-term reductions in road fatalities from the 1990s onward. During the period examined here, New Zealand showed a less consistent pattern, prompting questions about the factors contributing to the increase in casualties after 2013. New Zealand's rate is notably higher than many comparable countries:
OECD old dataOECD new data
The increase in road deaths and injuries since the minimum in 2013 may be related to the widespread availability and use while driving of smartphones (especially texting) despite nominal, low penalty laws against it. The relation between mobile phone availability and casualties is even more apparent in the dramatic increase in nonfatal injuries as compared to deaths. As there are about 40 times more injuries than deaths, the disastrous effects on society of inattention due to using mobile phones while driving may be vastly under-appreciated.
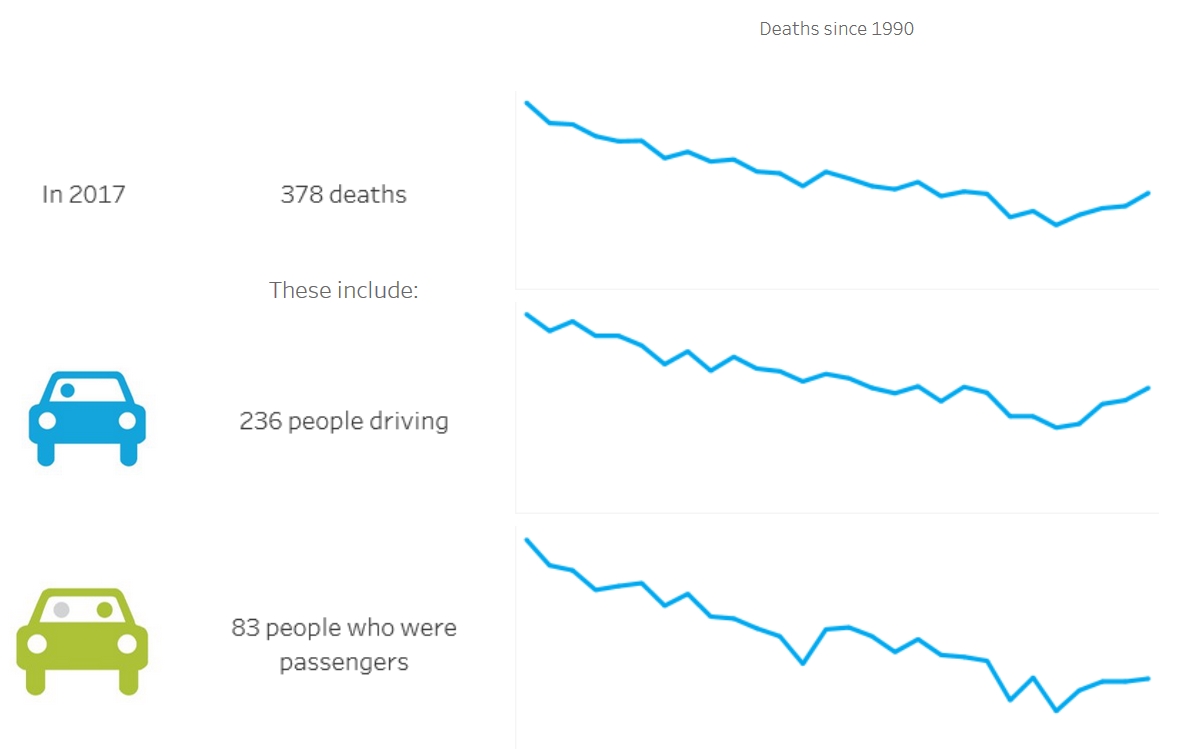
The Ministry of Transport data on road deaths is below (1990 - 2017). Why the upturn since 2013? That is the question everyone is asking.
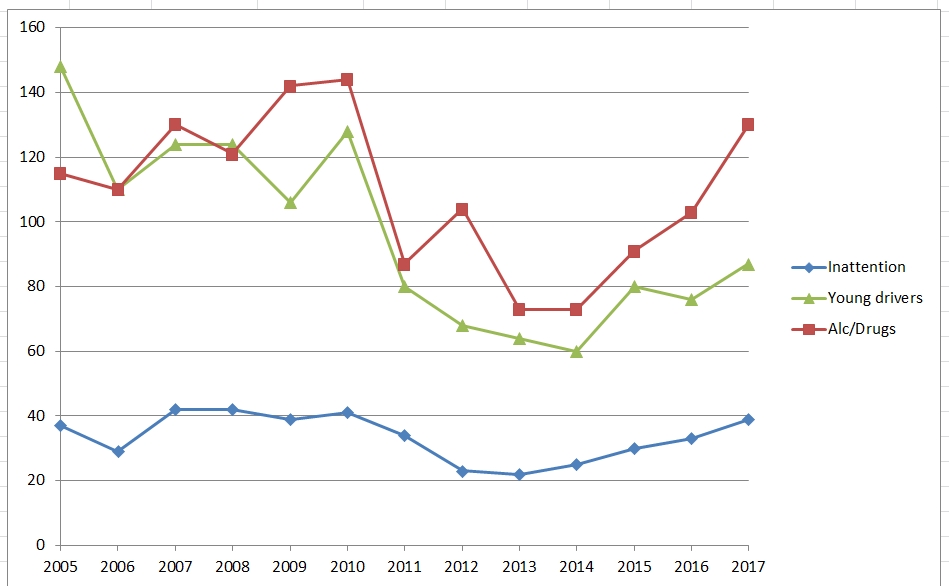
Ministry of Transport data on fatalities involving fatigue and diverted attention are shown below. In 2017, diverted attention was associated with 39 road deaths, highlighting the potential role of distraction in road trauma.
Fatality trends in New Zealand
Ministry of Transport data showed a long-term decline in road deaths through the 1990s and early 2000s, followed by a notable increase after 2013.
Inattention and fatigue
The Ministry of Transport reports separate statistics for fatigue and diverted attention. While fatigue-related fatalities showed no obvious increase over this period, fatalities associated with diverted attention increased substantially.
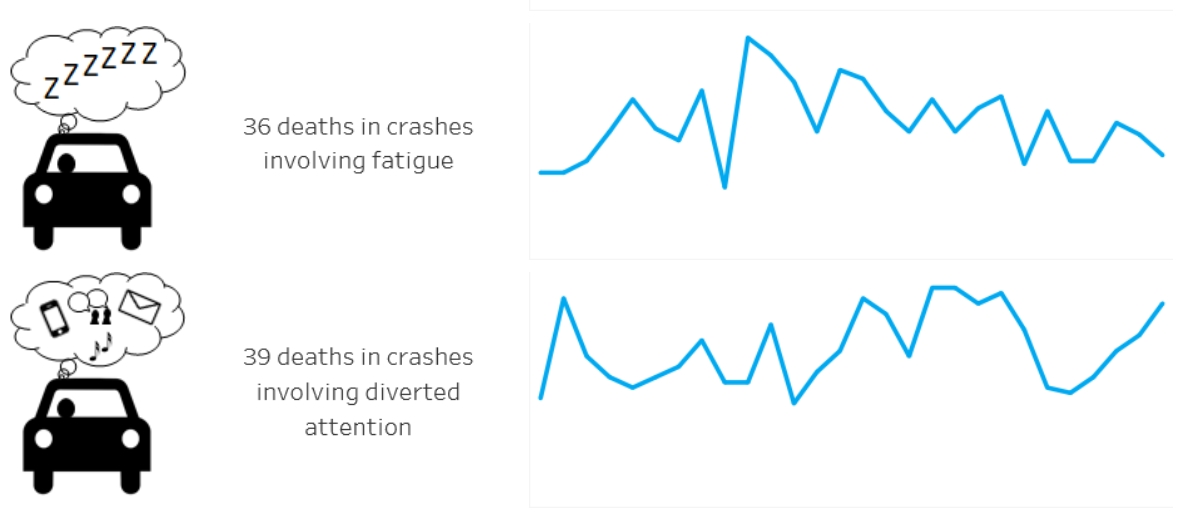
Although determining distraction after a crash is inherently difficult, the data suggest that inattention may play a larger role in road trauma than is often recognised.
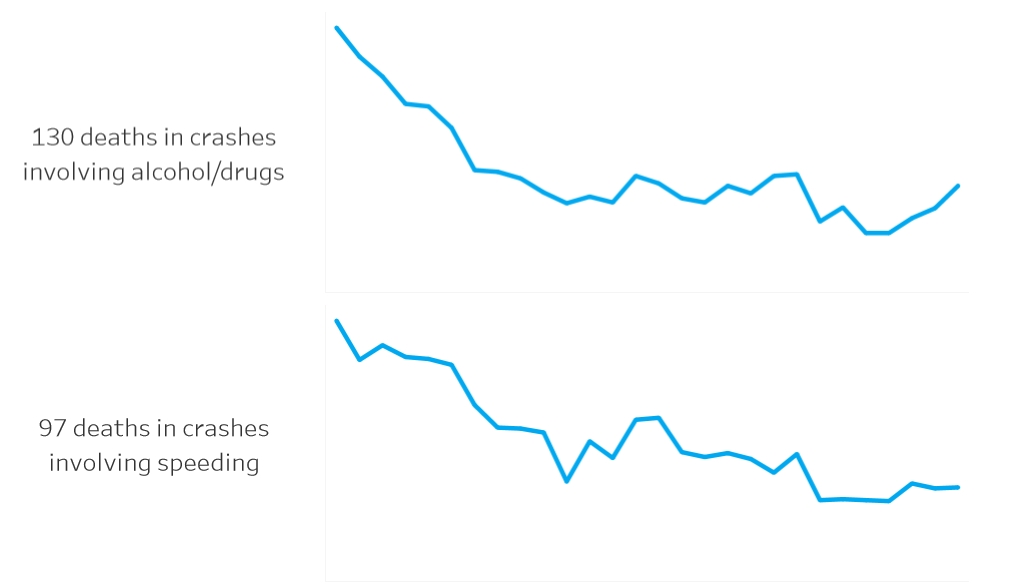
Speed, alcohol, and drugs
Speeding and alcohol or drug impairment remain important contributors to road trauma. However, the patterns below suggest that they do not fully explain the post-2013 increase in fatalities.
Young drivers and attention
Ministry of Transport data on fatalities involving young drivers are shown below.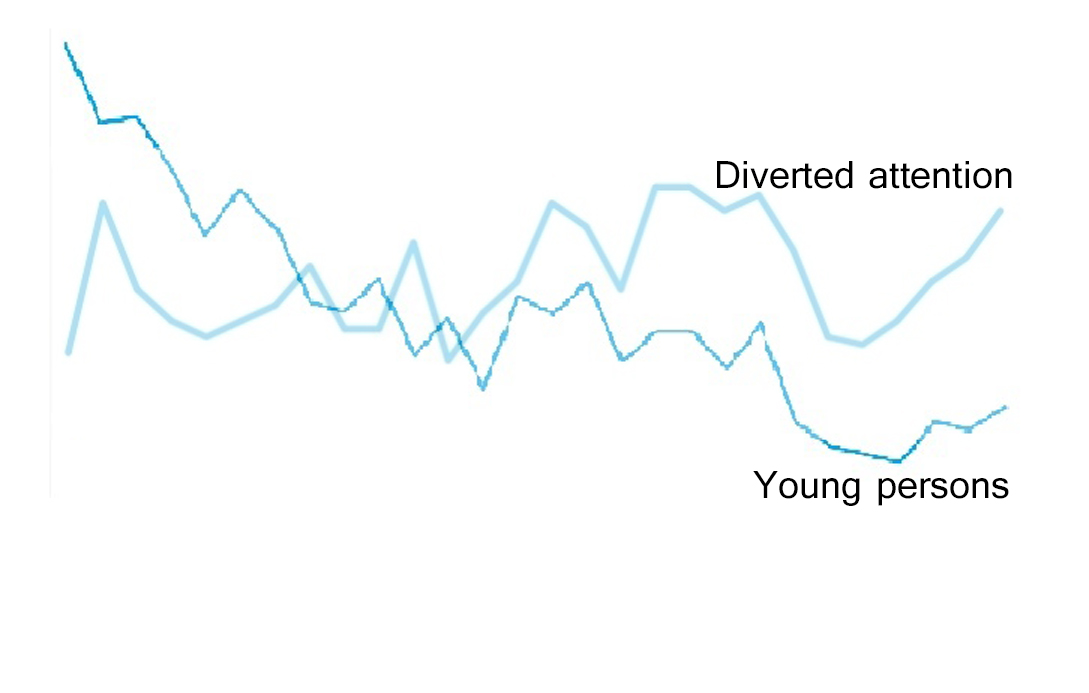
Young drivers have consistently shown higher rates of mobile phone use while driving and are overrepresented in crash statistics. The trends in young-driver fatalities appear broadly similar to trends involving inattention, suggesting that attention-related factors deserve further investigation. One telling piece of evidence comes from young person (15 - 24 yrs) deaths which have been increasing in recent years too. Their pattern closely follows the pattern for deaths involving inattention and, since 2005, is strongly correlated (.76) - ups and downs in diverted attention casualties correspond with ups and downs in young person casualties. Young drivers have consistently been shown to text and drive at much higher rates than older drivers although older drivers have high rates of phone use and texting too. As expected, inattention deaths correlates strongly with all fatalities (.75) since all fatalities data includes young persons data. Alcohol/drugs casualties (in all age groups) is correlated with young person casualties (.72) too, but less than is inattention (.76). It is important to realise that for young persons, mobile phone use is very high (e.g., typically at least 50% admit to texting). Therefore, distracted driving is a significant factor in young person casualties and needs to be addressed. This is all compelling evidence for a significant relation between distracted driving and road casualties in NZ and supports the concern about drivers and distracted driving.
Actual data values
Scaled comparison of major factors
When data on deaths from the groups involving: (1) inattention, (2) alcohol/drugs, (3) young persons, and (4) all deaths are scaled to maximum values, visualisation of the trend is clear:
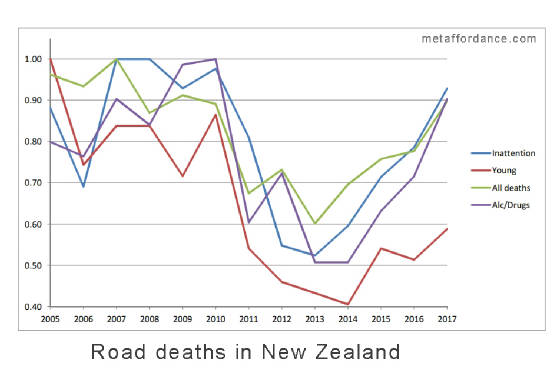
No more data is needed - we have plenty from MOT and research groups for the government to impose stiffer penalties in order to discourage distracted driving and, especially, texting (texting should carry a special extra penalty to that of talking on a phone).
Penalties and disincentives
Further consideration of the relation between mobile phone use and casualties is warranted and a re-evaluation of mobile phone disincentives (and penalties) is needed if NZ is to stop wasting time and is to start to reverse this much-pondered and debated recent increase in casualties and to see a reduction in road trauma to a level similar to comparable countries.
Consider penalties for hand-held use of a mobile phone:
Penalties in UK: GBP200 (NZD$460) and HALF of total points (6/12).
Penalties in NZ: $150 (2026) and 20 demerit points - still only a fifth of total points (20/100).
Penalties in Australia are comparable to the UK (e.g., Queensland). Australia started banning phone use during 2000s and all states now have mobile phone penalties as high as A$1251 (QLD). New Zealand did not introduce phone laws until November 2009.
Having conducted the world's first actual on-road studies of distracted driving I concur that inattentive driving is responsible for as much as 80% of all crashes (Treffner et al., 2002, 2004, 2008). Attention is a powerful but delicate thing (e.g., change blindness). Inherently unstable systems such as standing, walking, and driving require attention in order to stabilise them (Treffner & Kelso, 1999). Where attention is directed can also alter motor control and coordination in subtle and surprising ways (Amazeen et al., 1998; Treffner & Turvey, 1995); an everyday case is driving. Further, using a mobile phone, even hands-free, while driving always leads to some degree of cognitive interference and in its worst form, "inattentional blindness". This is a serious violation of the basic expectations of care and respect for other road users. But in NZ the low penalty of 20 points is even less than the misdemeanor of not displaying L-plates (25 points). The current historic and rather trivial penalty for phone use does not acknowledge the serious damage inattentive driving is increasingly having on society nor does it even attempt to address the problem by imposing realistic penalties that would make careless drivers think twice...unless they don't care about losing their license (or worse).
Should penalties be increased?
Surely yes.
Three forms of distraction
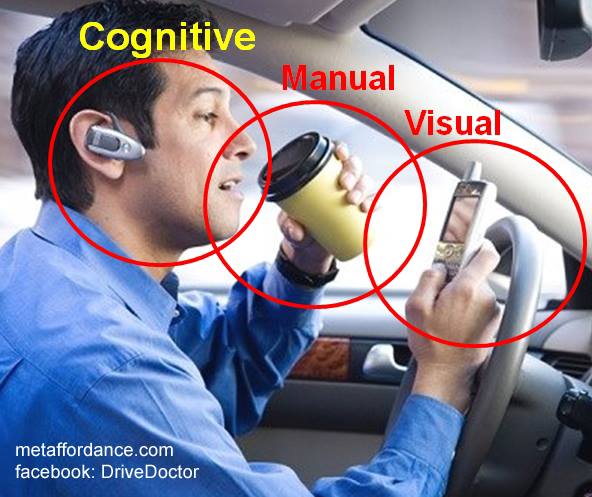
Speaking on a phone while driving introduces cognitive distraction, and often visual and manual distraction as well. Research consistently shows that attention is a limited resource and that driving performance degrades when attention is divided.
Interpretation
- Attention is fundamental to safe driving.
- Inattention contributes to a substantial proportion of crashes.
- Mobile phone use introduces cognitive interference even when hands-free.
- Smartphones create additional visual and manual distractions.
- Road safety initiatives should continue to address distraction alongside speed, alcohol, and fatigue.
The analysis presented here does not claim that mobile phone use is the sole cause of increasing road trauma. Rather, it suggests that distracted driving is an important contributing factor that deserves continued attention from researchers, policymakers, educators, and road users.
They finally concur with my analysis
"Ministry of Transport and the NZ Transport Agency commissioned several reports to investigate the trend. But none could pin the rising toll to usual factors like shifts in travel, employment or economic growth....New research into the country's appalling road toll figures has blamed alcohol and drivers on learner licences for a spike in crash deaths....Three big factors jumped out: alcohol, learner licences and a regional spate in Auckland...over the 2014 to 2017 period, the odds of alcohol being a factor in a fatal crash shot up by about 40 per cent."
— NZ Herald: https://tinyurl.com/v7aya7c
I showed this before the above research was published.
See final graph above showing upward trends since 2013.
They do not admit that DISTRACTED DRIVING is the third major factor, especially non-fatalities (which they often ignore). It is NOT speeding or fatigue as Police claim. It is alcohol/drugs, young drivers, and distracted driving.
In fact, they say "inattention" fatalities (how do they even know it was inattention if they are deceased?) increased from 27 (2014) to 41 (2017) - up 53%. That is a huge increase in inattention fatalities. Compare alcohol: 77 to 136 - just 43%. They continue to ignore the underestimated epidemic of inattentive driving.
The cause of increasing road deaths is not that they are young, or still on a Learner's Licence. They are young (<25 yrs), unskilled, inexperienced, and the demographic most at risk from INATTENTION.
The CAUSE is psychological - cognitive distraction and inattention.
The REASON is they are not committed to developing the care and awareness required to pass the full license test. They are especially unaware of the attention and respect required to drive safely. The important MESSAGE here is that it is young unskilled drivers (<25 yrs) that are crashing the most BECAUSE they are the most susceptible to inattention and drugs/alcohol. It is next to impossible to show the extent of the massive role of inattention in crash causality studies, especially when the victim is deceased. Inattention in some form is the reason and cause of virtually ALL crashes. This is completely underestimated and ignored (as in their report) in attempts to identify the "causes" of crashes. Reasons are not the same as causes but both can explain NZ's recent increase in road casualties.
Media discussion of the above research: Media discussion
See new LinkedIn version of this article with extra analysis: LinkedIn article
Workshops on attentive driving: Workshops
References on driving, attention, phones, and speech-hand coordination
Treffner, P. J. (2020). Distracted driving in New Zealand. Invited talk plus workshop, 43rd annual conference of the New Zealand Institute of Driver Educators. Wellington, 2018.
Treffner, P. J., Peter, M., & Kleidon, M. (2008). Gestures and phases: The dynamics of speech-hand communication. Ecological Psychology, 20, 32-64.
Treffner, P. J., & Barrett, R. (2004). Hands-free mobile phone speech while driving degrades coordination and control. Transportation Research, Part F: Traffic Psychology and Behaviour, 7, 229-246.
Treffner, P. J., Barrett, R., & Petersen, A. J. (2002). Stability and skill in driving. Human Movement Science, 21, 749-784.
Treffner, P. J., & Peter, M. (2002). Intentional and attentional dynamics of speech-hand coordination. Human Movement Science, 21, 641-697.
Treffner, P. J., & Kelso, J. A. S. (1999). Dynamic encounters: Long-memory during functional stabilization. Ecological Psychology, 11, 103-137.
Amazeen, E., Amazeen, P., Treffner, P. J., & Turvey, M. T. (1997). Attention and handedness in bimanual coordination dynamics. Journal of Experimental Psychology: Human Perception and Performance, 23, 1552-1560.
Treffner, P. J., & Turvey, M. T. (1996). Symmetry, broken symmetry, and the dynamics of bimanual coordination. Experimental Brain Research, 107, 463-478.
Treffner, P. J., & Turvey, M. T. (1995). Handedness and the asymmetric dynamics of bimanual rhythmic coordination. Journal of Experimental Psychology: Human Perception and Performance, 21, 318-333.
See also: Attention and driving | Publications